

enhanced_prompt null | enhanced_completion stringlengths 3.8k 10.8k | category stringclasses 7
values | chart_type stringclasses 17
values | difficulty stringclasses 3
values | domain stringclasses 30
values | id stringlengths 8 8 | ood_flag bool 2
classes | user_reasoning_trace stringlengths 1.51k 2.07k |
|---|---|---|---|---|---|---|---|---|
null | As **DataViz-Pro**, I have analyzed your cybersecurity operations scenario. The metrics provided represent a classic performance pipeline (e.g., a phishing simulation, user-onboarding flow, or security service lead-gen).
Here is my rigorous visualization recommendation and evaluation of the stakeholder's proposal.
-... | interpretation | dot_plot | hard | cybersecurity operations | viz_0752 | true | 1. Data structure: the fields (campaign impressions, spend, clicks, conversions, customer value) mix categorical grouping variables with at least one quantitative measure, set in a cybersecurity operations context.
2. Analytical goal: the task is to explain a funnel, which determines which perceptual channel must carry... |
null | ***Note on Domain Discrepancy:*** *The provided fields (warehouse stock, sales velocity, lead time, SKU) are characteristic of Supply Chain/Inventory Management, while the domain is listed as Cybersecurity Operations. Assuming this represents Hardware Asset Management within a Cyber-Ops context (e.g., managing stockpil... | dashboard_design | small_multiples | hard | a cybersecurity operations project | viz_0757 | false | 1. Data structure: the fields (warehouse stock, sales velocity, lead time, replenishment frequency by SKU) mix categorical grouping variables with at least one quantitative measure, set in a a cybersecurity operations project context.
2. Analytical goal: the task is to inspect an association, which determines which per... |
null | ### 1. Step-by-Step Reasoning
**Domain & Field Mismatch Resolution:**
The domain is listed as *Logistics*, but the available fields (*Portfolio Return, Volatility, Asset Class, Month*) are distinctly financial. In a logistics context, this implies an analysis of a logistics corporation's treasury/investment portfolio... | chart_revision | choropleth | hard | logistics | viz_0820 | true | 1. Data structure: the fields (portfolio return, volatility, asset class, month) mix categorical grouping variables with at least one quantitative measure, set in a logistics context.
2. Analytical goal: the task is to find concentration, which determines which perceptual channel must carry the primary comparison.
3. C... |
null | ### 1. Step-by-Step Reasoning
**Step 1: Deconstruct the Data Structure**
You have 8 independent categories (Regions) and 4 metrics (Orders, Customers, Refunds, Revenue).
* **Critical Distinction:** Regions are nominal categories, not sequential stages.
* **Metric Relationship:** While Orders, Customers, and Reve... | visualization_selection | funnel | expert | public policy | viz_1606 | false | 1. Data structure: the fields (weekly orders, active customers, refunds, revenue for 8 regions) mix categorical grouping variables with at least one quantitative measure, set in a public policy context.
2. Analytical goal: the task is to rank categories, which determines which perceptual channel must carry the primary ... |
null | ### 1. Step-by-Step Reasoning
**Data & Goal Analysis:**
* **Target Variable:** `portfolio return` (Quantitative, Continuous). This is the metric we are distributing.
* **Grouping Variable:** `asset class` (Categorical). We need to compare distributions across different policy investment buckets (e.g., Equities, Fi... | chart_critique | dot_plot | expert | public policy | viz_0727 | true | 1. Data structure: the fields (portfolio return, volatility, asset class, month) mix categorical grouping variables with at least one quantitative measure, set in a public policy context.
2. Analytical goal: the task is to understand a distribution, which determines which perceptual channel must carry the primary compa... |
null | ### 1. Step-by-Step Reasoning
1. **Prerequisite Check (Time Dimension):** The analytical goal is to "separate signal from seasonality." Seasonality is, by definition, a time-based pattern. The provided field list (`website sessions`, `device`, `acquisition source`, `conversion`, `order value`) lacks an explicit tempo... | interpretation | pareto | hard | marketing | viz_0851 | false | 1. Data structure: the fields (website sessions, device, acquisition source, conversion, order value) mix categorical grouping variables with at least one quantitative measure, set in a marketing context.
2. Analytical goal: the task is to separate signal from seasonality, which determines which perceptual channel must... |
null | Hello. I am **DataViz-Pro**. I have analyzed your manufacturing scenario and your instinct to use a box plot.
While a box plot is excellent for comparing distributions, it has a fatal flaw for this specific analytical goal: it collapses the temporal dimension. A structural break is a time-series phenomenon where the ... | visualization_selection | box_plot | expert | manufacturing | viz_0235 | false | 1. Data structure: the fields (campaign impressions, spend, clicks, conversions, customer value) mix categorical grouping variables with at least one quantitative measure, set in a manufacturing context.
2. Analytical goal: the task is to identify a structural break, which determines which perceptual channel must carry... |
null | ### 1. Step-by-Step Reasoning
1. **Analyze the Goal & Constraint:** The analytical goal is to "inspect an association" within a Healthcare SaaS context. The primary constraint is a **mobile screen with limited width**. Mobile constraints prioritize vertical scrolling over horizontal panning, necessitating high-contra... | statistical_visualization | dot_plot | expert | SaaS | viz_1493 | false | 1. Data structure: the fields (patient wait time, department, arrival hour, acuity, discharge status) mix categorical grouping variables with at least one quantitative measure, set in a SaaS context.
2. Analytical goal: the task is to inspect an association, which determines which perceptual channel must carry the prim... |
null | ### 1. Step-by-Step Reasoning
**Step 1: Deconstruct the Analytical Goal**
The core directive is to "rank categories." In data visualization theory, ranking requires an ordered comparison of discrete groups (Region or Customer Segment). The human visual system perceives position along a common scale (length) more accur... | chart_revision | scatter | medium | energy | viz_1184 | false | 1. Data structure: the fields (loan size, risk score, default indicator, region, customer segment) mix categorical grouping variables with at least one quantitative measure, set in a energy context.
2. Analytical goal: the task is to rank categories, which determines which perceptual channel must carry the primary comp... |
null | ### 1. Step-by-Step Reasoning
**A. Deconstructing the "Funnel" Goal vs. Available Data**
A traditional funnel chart visualizes attrition through sequential stages (e.g., Application → Approval → Funding → Default). Your dataset lacks explicit stage identifiers, offering instead a snapshot of outcomes (`Default Indicat... | chart_revision | funnel | medium | energy | viz_0579 | true | 1. Data structure: the fields (loan size, risk score, default indicator, region, customer segment) mix categorical grouping variables with at least one quantitative measure, set in a energy context.
2. Analytical goal: the task is to explain a funnel, which determines which perceptual channel must carry the primary com... |
null | ### 1. Step-by-Step Reasoning
1. **Analyze Data & Goal:** We have 6 programs, 4 quarters, and 3 metrics (Enrollment, Completion, Dropout). The goal is to "compare composition," which prioritizes proportions (part-to-whole) over absolute volumes. Since Enrollment = Completion + Dropout + (implicit) Active/In-Progress,... | dashboard_design | scatter | expert | a finance project | viz_0724 | false | 1. Data structure: the fields (quarterly enrollment, completion, dropout counts for 6 programs) mix categorical grouping variables with at least one quantitative measure, set in a a finance project context.
2. Analytical goal: the task is to compare composition, which determines which perceptual channel must carry the ... |
null | ### 1. Step-by-Step Reasoning
1. **Analyze the Goal and Data Structure:** The core analytical goal is to **compare composition**. The data consists of 6 categorical programs and a temporal dimension (quarterly), with a logical relationship: Enrollment = Completion + Dropout. To understand program efficiency, we need ... | chart_specification | small_multiples | hard | retail | viz_1901 | true | 1. Data structure: the fields (quarterly enrollment, completion, dropout counts for 6 programs) mix categorical grouping variables with at least one quantitative measure, set in a retail context.
2. Analytical goal: the task is to compare composition, which determines which perceptual channel must carry the primary com... |
null | ### 1. Step-by-Step Reasoning
**A. Data Integrity & Domain Check**
Before selecting a chart, I must flag a critical discrepancy. The domain is listed as **Cybersecurity Operations**, but the fields (`portfolio return`, `volatility`, `asset class`) are strictly **Financial/Investment** metrics.
* **Implication:** Ei... | chart_revision | control_chart | expert | cybersecurity operations | viz_0799 | false | 1. Data structure: the fields (portfolio return, volatility, asset class, month) mix categorical grouping variables with at least one quantitative measure, set in a cybersecurity operations context.
2. Analytical goal: the task is to separate signal from seasonality, which determines which perceptual channel must carry... |
null | ### 1. Step-by-Step Reasoning
1. **Define the Core Metric:** The analytical goal is to understand a distribution. Among the available fields, `Order Value` is the primary continuous numerical variable suitable for this analysis.
2. **Filter for Relevance:** To analyze the distribution of actual spend, the dataset m... | dashboard_design | horizontal_bar | medium | a telecommunications project | viz_0615 | false | 1. Data structure: the fields (website sessions, device, acquisition source, conversion, order value) mix categorical grouping variables with at least one quantitative measure, set in a a telecommunications project context.
2. Analytical goal: the task is to understand a distribution, which determines which perceptual ... |
null | ### 1. Step-by-Step Reasoning
**The Analytical Challenge:**
In healthcare operations, "seasonality" refers to predictable cyclical patterns—such as higher ticket volumes on Mondays, slower resolutions during shift changes, or flu season surges. "Signal" represents the underlying operational health trend (e.g., process... | statistical_visualization | calendar_heatmap | medium | healthcare operations | viz_0771 | false | 1. Data structure: the fields (support ticket age, priority, issue class, resolution time, agent team) mix categorical grouping variables with at least one quantitative measure, set in a healthcare operations context.
2. Analytical goal: the task is to separate signal from seasonality, which determines which perceptual... |
null | ### 1. Step-by-Step Reasoning
1. **Identify the Core Conflict:** The analytical goal is to "explain a funnel" (show drop-off from sessions to conversion), but the delivery constraint specifies a "comparison where groups have unequal denominators."
2. **The Trap of Absolute Volume:** In marketing, `acquisition source... | statistical_visualization | calendar_heatmap | expert | marketing | viz_1209 | true | 1. Data structure: the fields (website sessions, device, acquisition source, conversion, order value) mix categorical grouping variables with at least one quantitative measure, set in a marketing context.
2. Analytical goal: the task is to explain a funnel, which determines which perceptual channel must carry the prima... |
null | Hello, I am **DataViz-Pro**. To identify a structural break in energy consumption across multiple assets for a static print report, we must prioritize pattern recognition, temporal alignment, and signal amplification over raw data exploration.
Here is my rigorous recommendation.
---
### 1. Step-by-Step Reasoning
* ... | chart_specification | scatter | expert | a retail project | viz_0986 | false | 1. Data structure: the fields (monthly electricity demand, temperature, building occupancy for 20 buildings) mix categorical grouping variables with at least one quantitative measure, set in a a retail project context.
2. Analytical goal: the task is to identify a structural break, which determines which perceptual cha... |
null | ### 1. Step-by-Step Reasoning
**Data Type Assessment:**
* **Dimensions:** `Machine ID` (Nominal, high cardinality), `Shift` (Ordinal, low cardinality).
* **Measures:** `Machine Cycle Time` (Ratio, continuous), `Defect Count` (Ratio, discrete), `Production Volume` (Ratio, continuous).
**Analytical Goal Decompositi... | interpretation | horizontal_bar | hard | telecommunications | viz_0875 | false | 1. Data structure: the fields (machine cycle time, defect count, machine ID, shift, production volume) mix categorical grouping variables with at least one quantitative measure, set in a telecommunications context.
2. Analytical goal: the task is to compare groups, which determines which perceptual channel must carry t... |
null | ### 1. Step-by-Step Reasoning
**A. Domain & Data Discrepancy Check**
* **Observation:** The stated domain is "Manufacturing," but the available fields (`farm yield`, `rainfall`, `soil class`) are distinctly agricultural.
* **Resolution:** This visualization should be framed for a **Manufacturing Supply Chain Exec... | interpretation | horizontal_bar | hard | manufacturing | viz_0766 | false | 1. Data structure: the fields (farm yield, rainfall, irrigated area, soil class, district) mix categorical grouping variables with at least one quantitative measure, set in a manufacturing context.
2. Analytical goal: the task is to show change over time, which determines which perceptual channel must carry the primary... |
null | ### 1. Step-by-Step Reasoning
1. **Deconstruct the Analytical Goal:** The core task is to "inspect an association" between quantitative measures across 8 regions. The most rigorous method for revealing the relationship between two continuous variables is a **Scatter Plot**. Bar charts show magnitude; line charts show ... | chart_specification | histogram | hard | logistics | viz_1245 | true | 1. Data structure: the fields (weekly orders, active customers, refunds, revenue for 8 regions) mix categorical grouping variables with at least one quantitative measure, set in a logistics context.
2. Analytical goal: the task is to inspect an association, which determines which perceptual channel must carry the prima... |
null | ### 1. Step-by-Step Reasoning
1. **Deconstruct the Analytical Goal:** The core task is to "inspect an association." In data visualization, this specifically calls for examining the bivariate or multivariate relationships between quantitative variables (e.g., does a larger customer base yield proportionally higher rev... | interpretation | treemap | hard | a energy project | viz_0344 | true | 1. Data structure: the fields (weekly orders, active customers, refunds, revenue for 8 regions) mix categorical grouping variables with at least one quantitative measure, set in a a energy project context.
2. Analytical goal: the task is to inspect an association, which determines which perceptual channel must carry th... |
null | ### 1. Step-by-Step Reasoning
**A. Critique of the Stakeholder's Proposal (Pie Chart)**
The proposal to use a pie chart is fundamentally unsound for three primary reasons:
1. **Wrong Relationship:** Pie charts depict *part-to-whole* composition, not performance comparison.
2. **Magnitude Distortion & Dimensionality:*... | interpretation | dot_plot | medium | finance | viz_1104 | true | 1. Data structure: the fields (warehouse stock, sales velocity, lead time, replenishment frequency by SKU) mix categorical grouping variables with at least one quantitative measure, set in a finance context.
2. Analytical goal: the task is to compare performance fairly despite different group sizes, which determines wh... |
null | As **DataViz-Pro**, I have analyzed your requirements. While the domain is an "education project," the data fields provided are strictly **Supply Chain/Inventory Management**. Assuming this project involves the physical distribution of learning materials (e.g., textbooks, tablets), the "funnel" cannot be a traditional ... | interpretation | heatmap | hard | a education project | viz_1348 | false | 1. Data structure: the fields (warehouse stock, sales velocity, lead time, replenishment frequency by SKU) mix categorical grouping variables with at least one quantitative measure, set in a a education project context.
2. Analytical goal: the task is to explain a funnel, which determines which perceptual channel must ... |

This dataset is a remastered version prepared using Adaption's Adaptive Data platform.
adaption-dataviz_expert_recommendations
This dataset contains expert-level data visualization recommendations generated for diverse analytical scenarios across multiple domains. Each entry includes a specific prompt detailing the domain, available fields, and constraints, paired with a rigorous response specifying chart types, encodings, and design justifications. The content focuses on best practices for visual storytelling, addressing pitfalls like causation confusion and accessibility requirements.
Dataset size
There are 2,000 data points in this dataset. This is an instruction tuning dataset.
Quality of Remastered Dataset
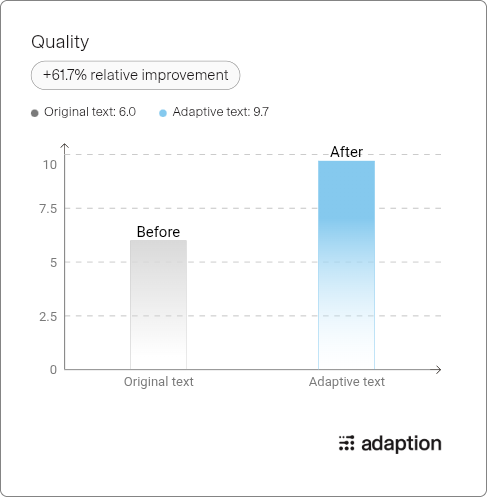
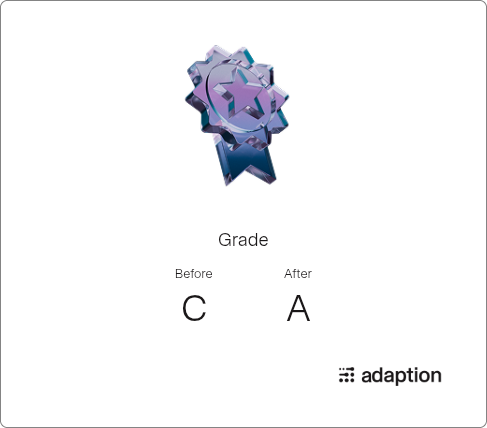
The final quality is A, with a relative quality improvement of 61.7%.
Domain
- Data-analysis-visualization (100%)
Language
- English (100%)
Tone
- Analytical (66%)
- Technical (28%)
- Professional (6%)
Evaluation Results
Quality Gains:
Grade Improvement:
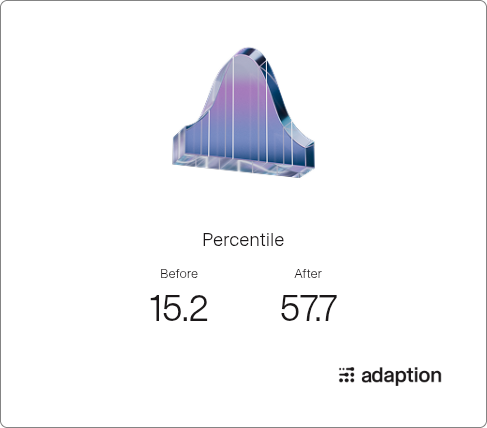
Percentile Chart:
- Downloads last month
- 7