| import pandas as pd |
| import streamlit as st |
| import streamlit_ace as stace |
| import duckdb |
| import numpy as np |
| import scipy |
| import plotly.express as px |
| import plotly.figure_factory as ff |
| import matplotlib.pyplot as plt |
| import sklearn |
| from ydata_profiling import ProfileReport |
| from streamlit_pandas_profiling import st_profile_report |
|
|
| st.set_page_config(page_title="PySQLify", page_icon="🔎", layout="wide") |
| st.title("PySQLify") |
| st.write("_Data Analysis_ Tool") |
|
|
| p = st.write |
| print = st.write |
|
|
| @st.cache |
| def _read_csv(f, **kwargs): |
| df = pd.read_csv(f, on_bad_lines="skip", **kwargs) |
| |
| df.columns = [c.strip() for c in df.columns] |
| return df |
|
|
|
|
| SAMPLE_DATA = { |
| "Churn dataset": "https://raw.githubusercontent.com/AtashfarazNavid/MachineLearing-ChurnModeling/main/Streamlit-WebApp-1/Churn.csv", |
| "Periodic Table": "https://gist.githubusercontent.com/GoodmanSciences/c2dd862cd38f21b0ad36b8f96b4bf1ee/raw/1d92663004489a5b6926e944c1b3d9ec5c40900e/Periodic%2520Table%2520of%2520Elements.csv", |
| "Movies": "https://raw.githubusercontent.com/reisanar/datasets/master/HollywoodMovies.csv", |
| "Iris Flower": "https://gist.githubusercontent.com/netj/8836201/raw/6f9306ad21398ea43cba4f7d537619d0e07d5ae3/iris.csv", |
| "World Population": "https://gist.githubusercontent.com/curran/13d30e855d48cdd6f22acdf0afe27286/raw/0635f14817ec634833bb904a47594cc2f5f9dbf8/worldcities_clean.csv", |
| "Country Table": "https://raw.githubusercontent.com/datasciencedojo/datasets/master/WorldDBTables/CountryTable.csv", |
| "World Cities": "https://raw.githubusercontent.com/dr5hn/countries-states-cities-database/master/csv/cities.csv", |
| "World States": "https://raw.githubusercontent.com/dr5hn/countries-states-cities-database/master/csv/states.csv", |
| "World Countries": "https://raw.githubusercontent.com/dr5hn/countries-states-cities-database/master/csv/countries.csv" |
| } |
|
|
|
|
| def read_data(): |
| txt = "Upload a data file (supported files: .csv)" |
| placeholder = st.empty() |
| with placeholder: |
| col1, col2, col3 = st.columns([3, 2, 1]) |
| with col1: |
| file_ = st.file_uploader(txt, help="TODO: .tsv, .xls, .xlsx") |
| with col2: |
| url = st.text_input( |
| "Read from a URL", |
| placeholder="Enter URL (supported types: .csv and .tsv)", |
| ) |
| if url: |
| file_ = url |
| with col3: |
| selected = st.selectbox("Select a sample dataset", options=[""] + list(SAMPLE_DATA)) |
| if selected: |
| file_ = SAMPLE_DATA[selected] |
|
|
| if not file_: |
| st.stop() |
|
|
| placeholder.empty() |
| kwargs = {"skiprows": st.number_input("skip header", value=0, max_value=10)} |
| try: |
| return _read_csv(file_, **kwargs) |
| except Exception as e: |
| st.warning("Unsupported file type!") |
| st.stop() |
|
|
|
|
| def display(df): |
| view_info = st.checkbox("view data types") |
| st.dataframe(df, use_container_width=True) |
|
|
| |
| st.markdown(f"> <sup>shape `{df.shape}`</sup>", unsafe_allow_html=True) |
|
|
| if view_info: |
| types_ = df.dtypes.to_dict() |
| types_ = [{"Column": c, "Type": t} for c, t in types_.items()] |
| df_ = pd.DataFrame(types_) |
| st.sidebar.subheader("TABLE DETAILS") |
| st.sidebar.write(df_) |
|
|
|
|
| def code_editor(language, hint, show_panel, key=None): |
| |
| placeholder = st.empty() |
|
|
| default_theme = "solarized_dark" if language == "sql" else "chrome" |
|
|
| with placeholder.expander("CELL CONFIG"): |
| |
| _THEMES = stace.THEMES |
| _KEYBINDINGS = stace.KEYBINDINGS |
| col21, col22 = st.columns(2) |
| with col21: |
| theme = st.selectbox("Theme", options=[default_theme] + _THEMES, key=f"{language}1{key}") |
| tab_size = st.slider("Tab size", min_value=1, max_value=8, value=4, key=f"{language}2{key}") |
| with col22: |
| keybinding = st.selectbox("Keybinding", options=[_KEYBINDINGS[-2]] + _KEYBINDINGS, key=f"{language}3{key}") |
| font_size = st.slider("Font size", min_value=5, max_value=24, value=14, key=f"{language}4{key}") |
| height = st.slider("Editor height", value=230, max_value=777,key=f"{language}5{key}") |
| |
| if not show_panel: |
| placeholder.empty() |
|
|
| content = stace.st_ace( |
| language=language, |
| height=height, |
| show_gutter=False, |
| |
| placeholder=hint, |
| keybinding=keybinding, |
| theme=theme, |
| font_size=font_size, |
| tab_size=tab_size, |
| key=key |
| ) |
|
|
| |
| |
| return content |
|
|
|
|
| @st.cache |
| def query_data(sql, df): |
| try: |
| return duckdb.query(sql).df() |
| except Exception as e: |
| st.warning("Invalid Query!") |
| |
|
|
|
|
| def download(df, key, save_as="results.csv"): |
| |
| |
| def convert_df(_df): |
| return _df.to_csv().encode("utf-8") |
|
|
| csv = convert_df(df) |
| st.download_button( |
| "Download", |
| csv, |
| save_as, |
| "text/csv", |
| key=key |
| ) |
|
|
|
|
| def display_results(query: str, result: pd.DataFrame, key: str): |
| st.dataframe(result, use_container_width=True) |
| st.markdown(f"> `{result.shape}`") |
| download(result, key=key) |
|
|
|
|
| def run_python_script(user_script, key): |
| if user_script.startswith("st.") or ";" in user_script: |
| py = user_script |
| elif user_script.endswith("?"): |
| in_ = user_script.replace("?", "") |
| py = f"st.help({in_})" |
| else: |
| py = f"st.write({user_script})" |
| try: |
| cmds = py.split(";") |
| for cmd in cmds: |
| exec(cmd) |
| except Exception as e: |
| c1, c2 = st.columns(2) |
| c1.warning("Wrong Python command.") |
| if c2.button("Show error", key=key): |
| st.exception(e) |
|
|
|
|
| @st.experimental_singleton |
| def data_profiler(df): |
| return ProfileReport(df, title="Profiling Report") |
|
|
|
|
| def docs(): |
| content = """ |
| |
| # What |
| |
| Upload a dataset to process (manipulate/analyze) it using SQL and Python, similar to running Jupyter Notebooks. |
| To get started, drag and drop the dataset file, read from a URL, or select a sample dataset. To load a new dataset, refresh the webpage. |
| > <sub>[_src code_ here](https://github.com/iamaziz/sqlify)</sub> |
| |
| More public datasets available [here](https://github.com/fivethirtyeight/data). |
| |
| # Usage |
| |
| Example usage |
| |
| > After loading the sample Iris dataset from sklearn (or select it from the dropdown list), the lines below can be executed inside a Python cell: |
| |
| ```python |
| |
| from sklearn.datasets import load_iris; |
| from sklearn import tree; |
| iris = load_iris(); |
| X, y = iris.data, iris.target; |
| clf = tree.DecisionTreeClassifier(max_depth=4); |
| clf = clf.fit(X, y); |
| plt.figure(figsize=(7,3)); |
| fig, ax = plt.subplots() |
| tree.plot_tree(clf, filled=True, fontsize=4); |
| st.pyplot(fig) |
| ``` |
| |
| Which outputs the tree below: |
| |
| > <img width="1000" alt="image" src="https://user-images.githubusercontent.com/3298308/222992623-1dba9bad-4858-43b6-84bf-9d7cf78d61f7.png"> |
| |
| # SCREENSHOTS |
| |
| ## _EXAMPLE 1_ |
| 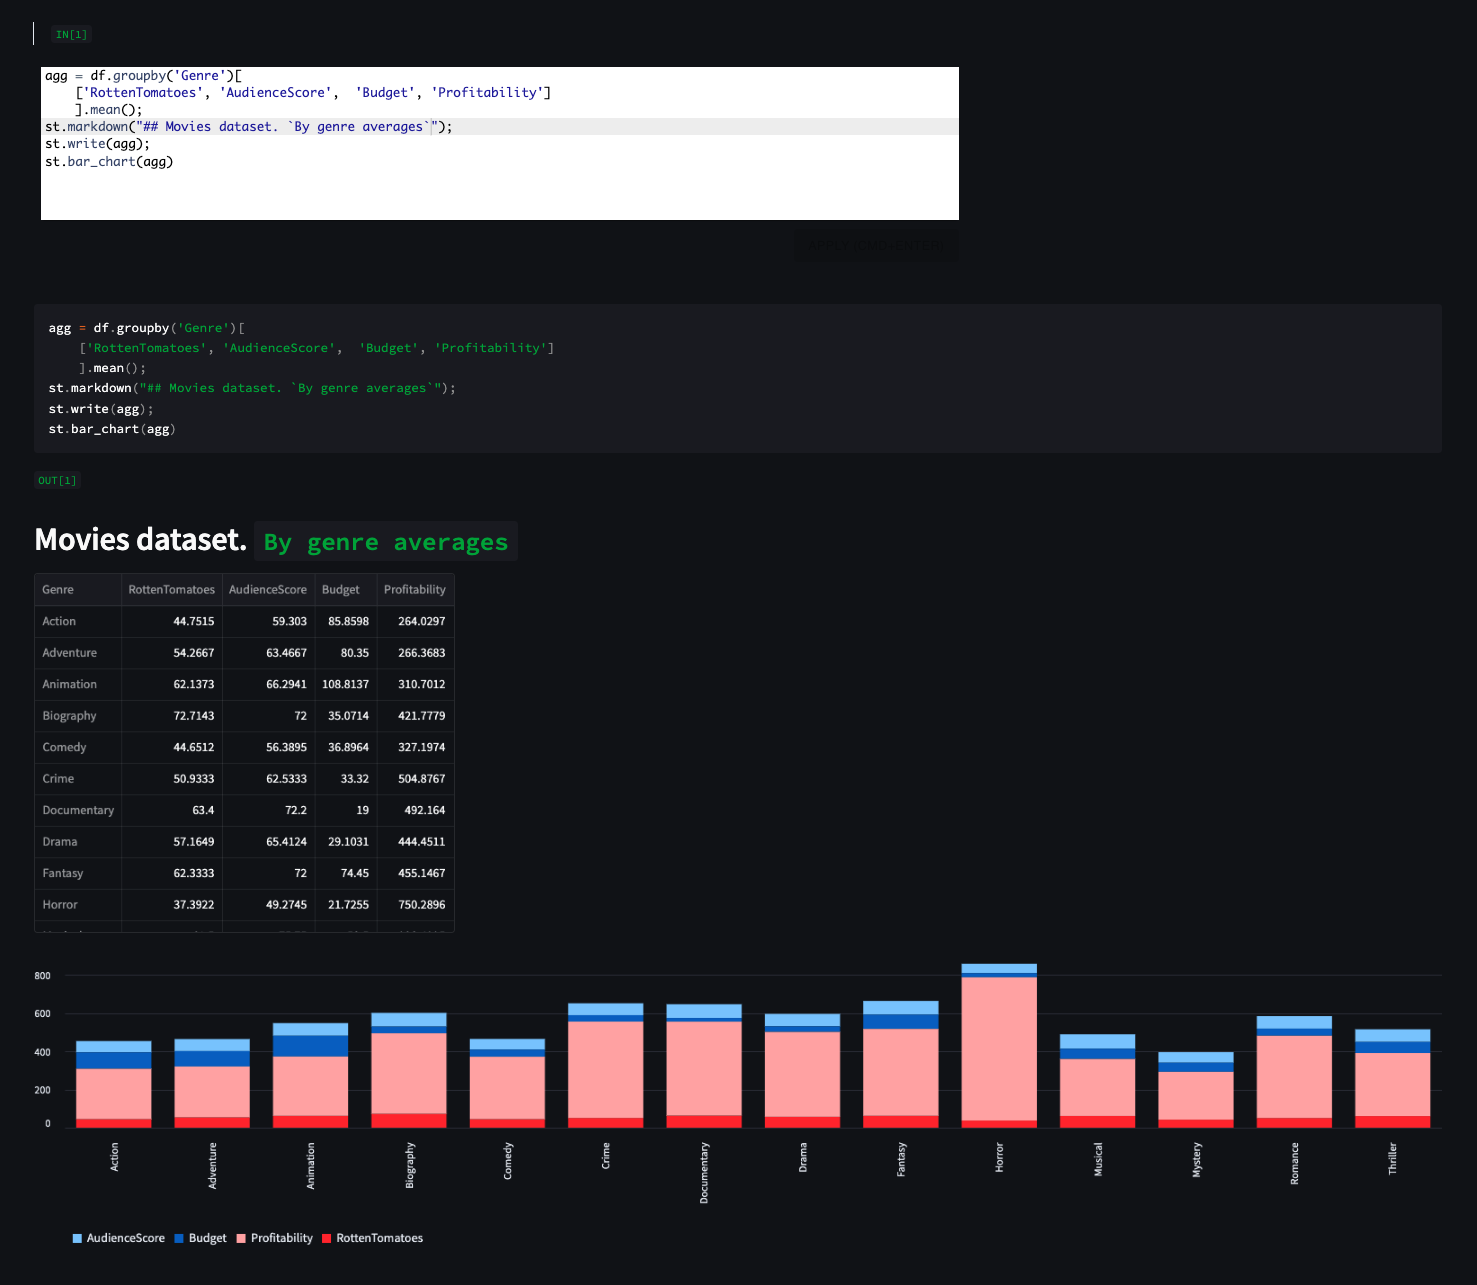 |
| |
| ## _EXAMPLE 2_ |
| 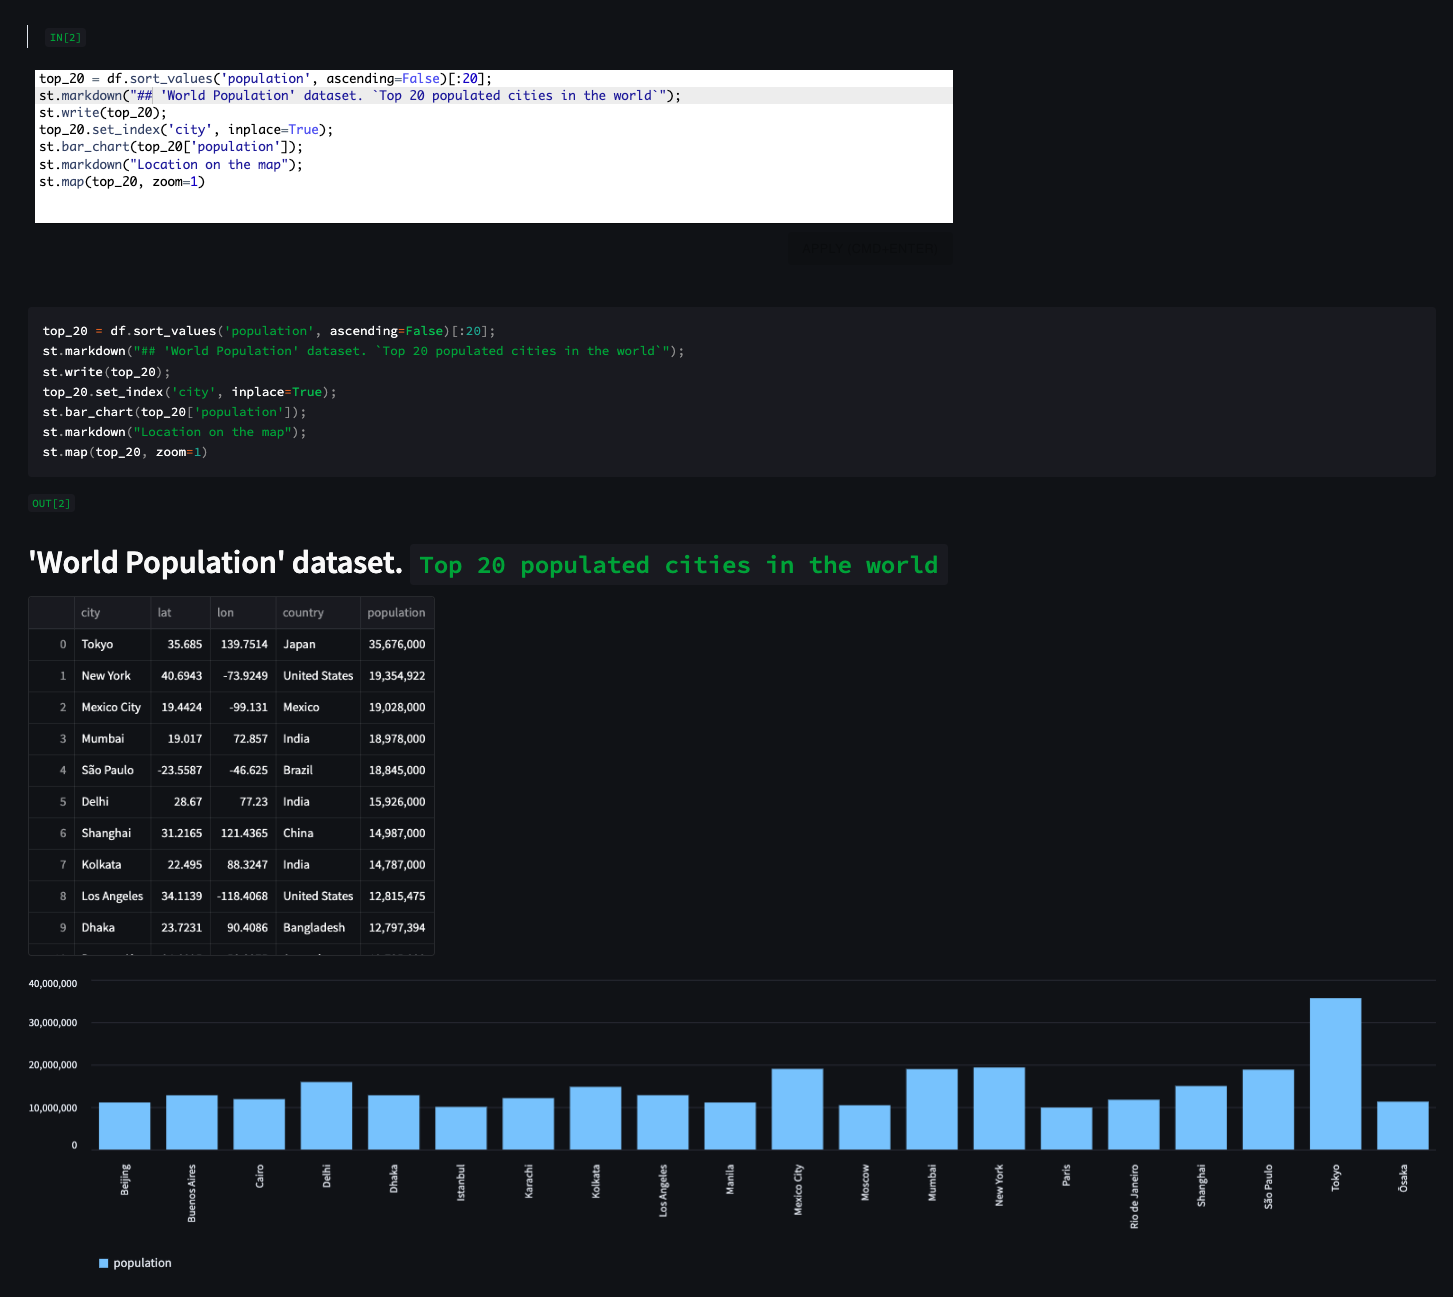 |
| 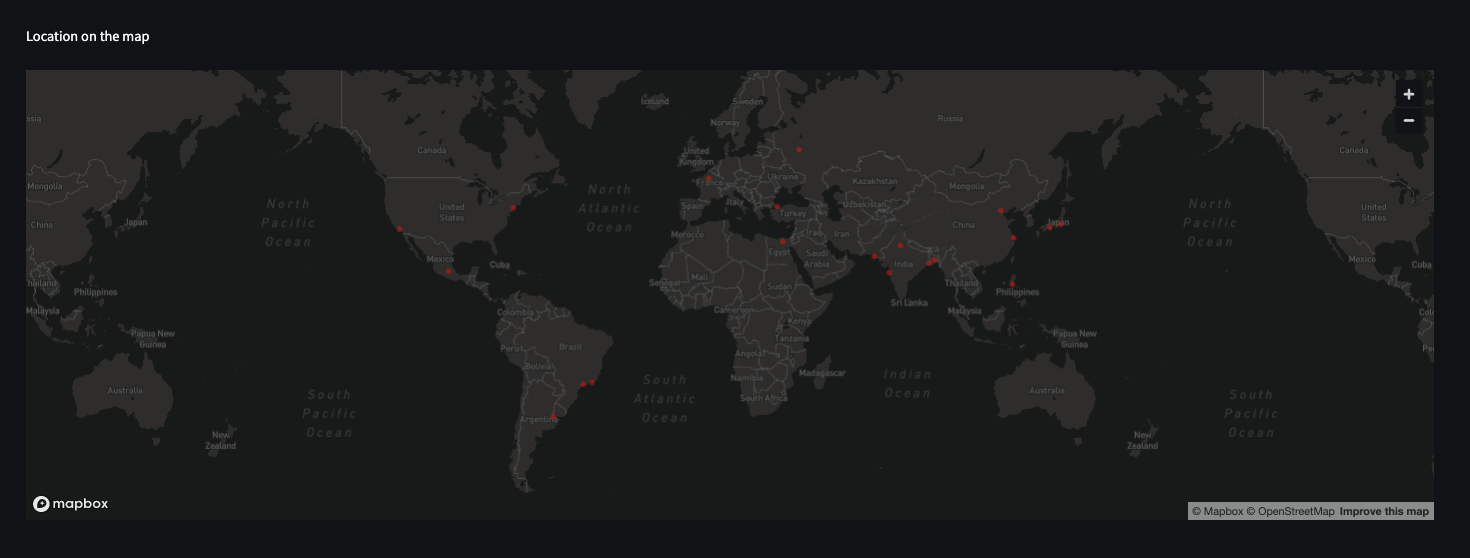 |
| |
| ## _EXAMPLE 3_ |
| 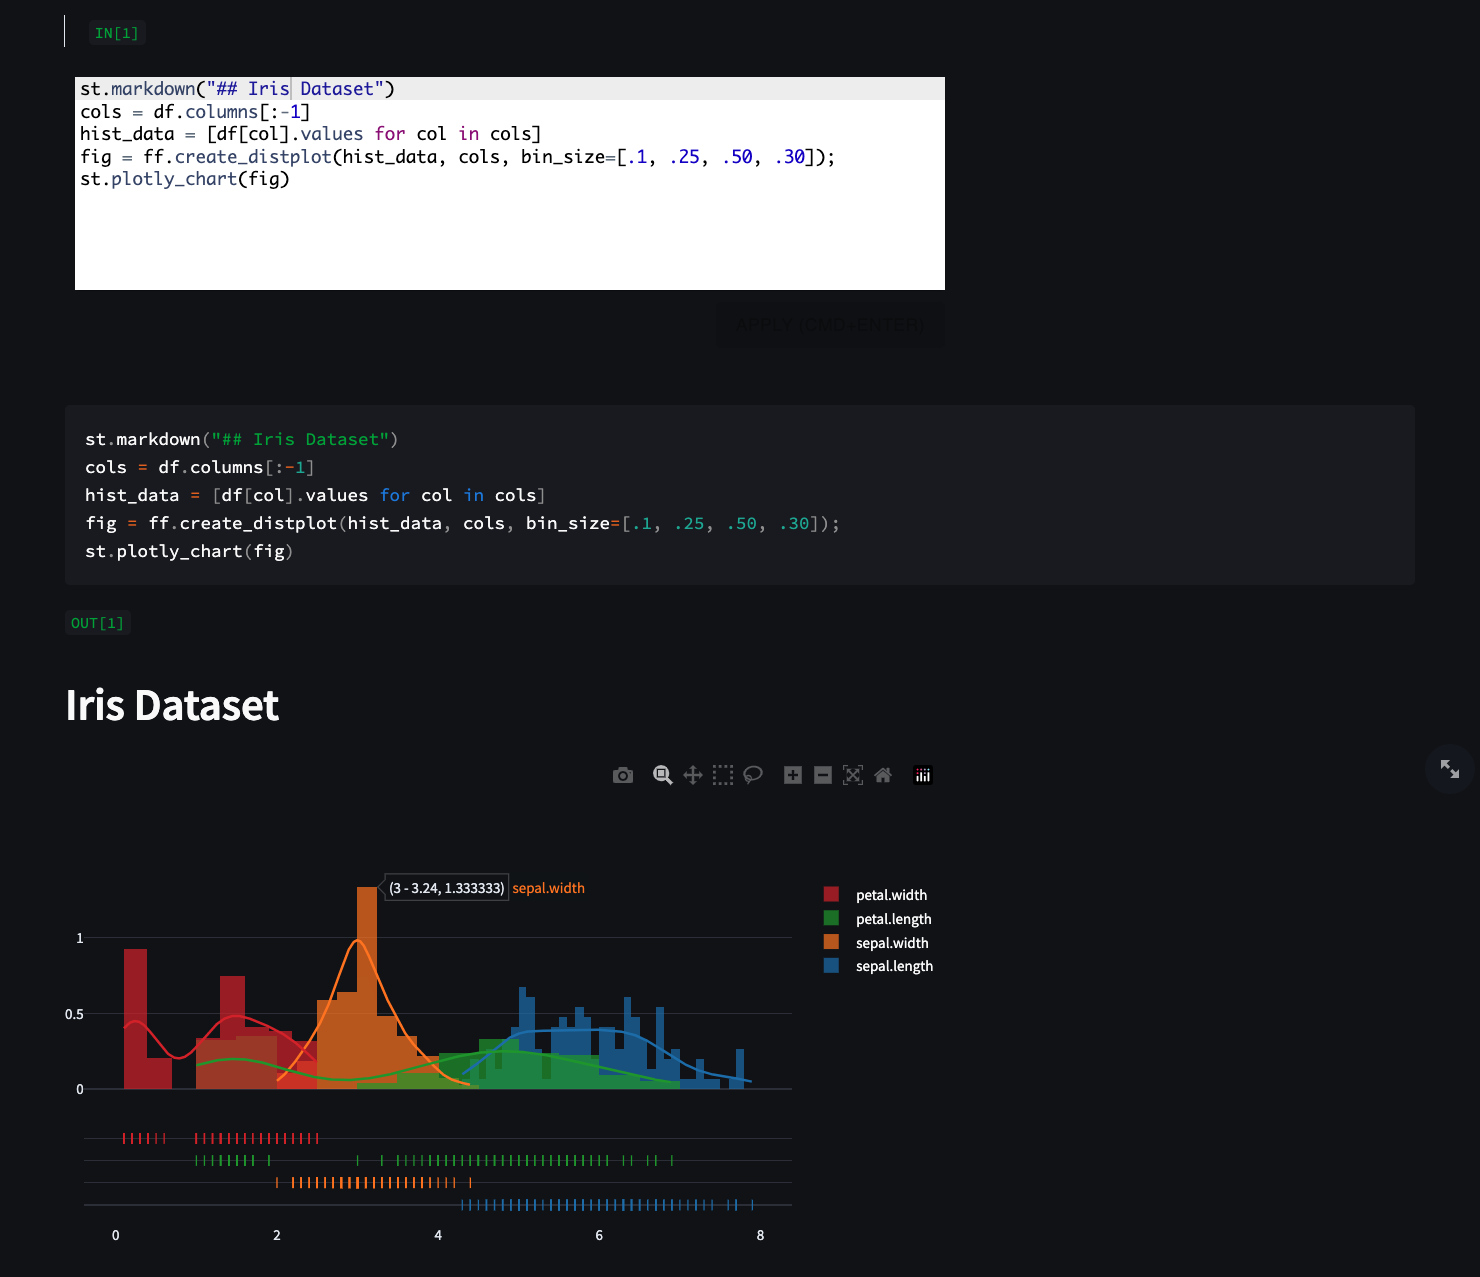 |
| |
| ## _EXAMPLE 4_ |
|  |
| |
| """ |
|
|
| with st.expander("READE"): |
| st.markdown(content, unsafe_allow_html=True) |
|
|
| return st.checkbox("Show more code examples") |
|
|
|
|
| def display_example_snippets(): |
| from glob import glob |
|
|
| examples = glob("./examples/*") |
| with st.expander("EXAMPLES"): |
| example = st.selectbox("", options=[""] + examples) |
| if example: |
| with open(example, "r") as f: |
| content = f.read() |
| st.code(content) |
|
|
|
|
| if __name__ == "__main__": |
| show_examples = docs() |
| if show_examples: |
| display_example_snippets() |
|
|
| df = read_data() |
| display(df) |
|
|
| |
| def sql_cells(df): |
| st.write("---") |
| st.header("SQL") |
| hint = """Type SQL to query the loaded dataset, data is stored in a table named 'df'. |
| For example, to select 10 rows: |
| SELECT * FROM df LIMIT 10 |
| Describe the table: |
| DESCRIBE TABLE df |
| """ |
| number_cells = st.sidebar.number_input("Number of SQL cells to use", value=1, max_value=40) |
| for i in range(number_cells): |
| col1, col2 = st.columns([2, 1]) |
| st.markdown("<br>", unsafe_allow_html=True) |
| col1.write(f"> `IN[{i+1}]`") |
| show_panel = col2.checkbox("Show cell config panel", key=f"sql_{i}") |
| key = f"sql{i}" |
| sql = code_editor("sql", hint, show_panel=show_panel, key=key) |
| if sql: |
| st.code(sql, language="sql") |
| st.write(f"`OUT[{i+1}]`") |
| res = query_data(sql, df) |
| display_results(sql, res, f"{key}{sql}") |
|
|
| |
| def python_cells(): |
| st.write("---") |
| st.header("Python") |
| hint = """Type Python command (one-liner) to execute or manipulate the dataframe e.g. `df.sample(7)`. By default, results are rendered using `st.write()`. |
| 📊 Visulaization example: from "movies" dataset, plot average rating by genre: |
| st.line_chart(df.groupby("Genre")[["RottenTomatoes", "AudienceScore"]].mean()) |
| 🗺 Maps example: show the top 10 populated cities in the world on map (from "Cities Population" dataset) |
| st.map(df.sort_values(by='population', ascending=False)[:10]) |
| |
| NOTE: for multi-lines, a semi-colon can be used to end each line e.g. |
| print("first line"); |
| print("second line); |
| """ |
| help = """ |
| For multiple lines, use semicolons e.g. |
| |
| ```python |
| |
| fig, ax = plt.subplots(); |
| ax.hist(df[[col1, col2]]); |
| st.pyplot(fig); |
| ``` |
| or |
| |
| ```python |
| groups = [group for _, group in df.groupby('class')]; |
| for i in range(3): |
| st.write(groups[i]['name'].iloc[0]) |
| st.bar_chart(groups[i].mean()) |
| ``` |
| """ |
| number_cells = st.sidebar.number_input("Number of Python cells to use", value=1, max_value=40, min_value=1, help=help) |
| for i in range(number_cells): |
| st.markdown("<br><br><br>", unsafe_allow_html=True) |
| col1, col2 = st.columns([2, 1]) |
| col1.write(f"> `IN[{i+1}]`") |
| show_panel = col2.checkbox("Show cell config panel", key=f"panel{i}") |
| user_script = code_editor("python", hint, show_panel=show_panel, key=i) |
| if user_script: |
| df.rename(columns={"lng": "lon"}, inplace=True) |
| st.code(user_script, language="python") |
| st.write(f"`OUT[{i+1}]`") |
| run_python_script(user_script, key=f"{user_script}{i}") |
|
|
|
|
| if st.sidebar.checkbox("Show SQL cells", value=True): |
| sql_cells(df) |
| if st.sidebar.checkbox("Show Python cells", value=True): |
| python_cells() |
|
|
| st.sidebar.write("---") |
|
|
| if st.sidebar.checkbox("Generate Data Profile Report", help="pandas profiling, generated by [ydata-profiling](https://github.com/ydataai/ydata-profiling)"): |
| st.write("---") |
| st.header("Data Profiling") |
| profile = data_profiler(df) |
| st_profile_report(profile) |
|
|
| st.write("---") |
